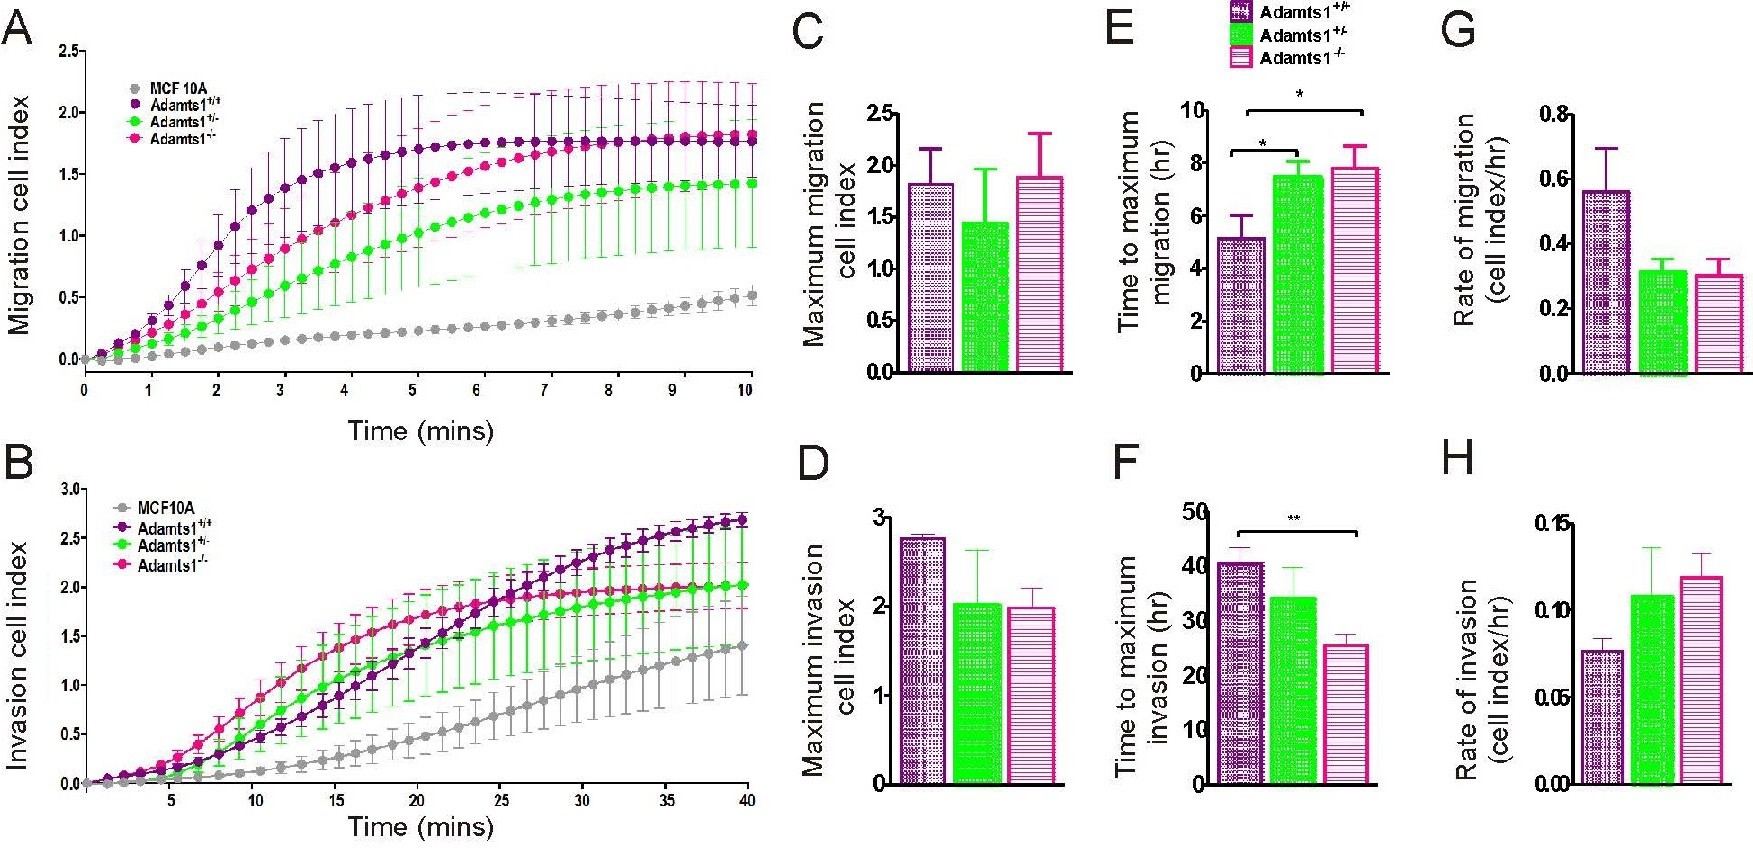
Fig. 5. Loss of Adamts1 impairs cell migration but not invasion. a) Migration profiles of MCF10A (n=6) and 1omMCC isolated from PyMT/Adamts1+/+ (n=5), Adamts1+/- (n=4) and Adamts1-/- (n=6) mice over 10 h. b) Invasion profiles of MCF10A (n=7) and 1omMCC isolated from Adamts1+/+ (n=5), Adamts1+/- (n=5) and Adamts1-/-/PyMT (n=8) mice over 40 h. c, d) maximum cell index, e, f) time at which the maximum was reached and g, h) rate were determined using the sigmoid regression model. The MCF10A cell line (grey circle) was included in all assay as an inter-assay control to assess the consistency of the method. Data is represented as mean ±SEM. Statistical analysis was performed using log-transformed data and One-way ANOVA with Fisher's LSD post hoc test. Significance was determined if p≤0.05 (*p≤0.05, **p≤0.005, ≤0.0005).